 Skip to content
EarthTime: A Powerful Data Visualization Tool for Global Change
EarthTime is a groundbreaking data visualization platform that animates global data. Developed by Carnegie Mellon University’s CREATE Lab, EarthTime helps people visualize dynamic processes on our planet in real time. Whether climate change and deforestation or population growth and urbanization, EarthTime transforms massive datasets into compelling interactive stories that are easy to explore and understand.
This new tool is being used by increasing numbers of educators, journalists, policymakers, researchers, and environmentalists to display complex global trends in visually striking, time-lapse animations.
What Is EarthTime?
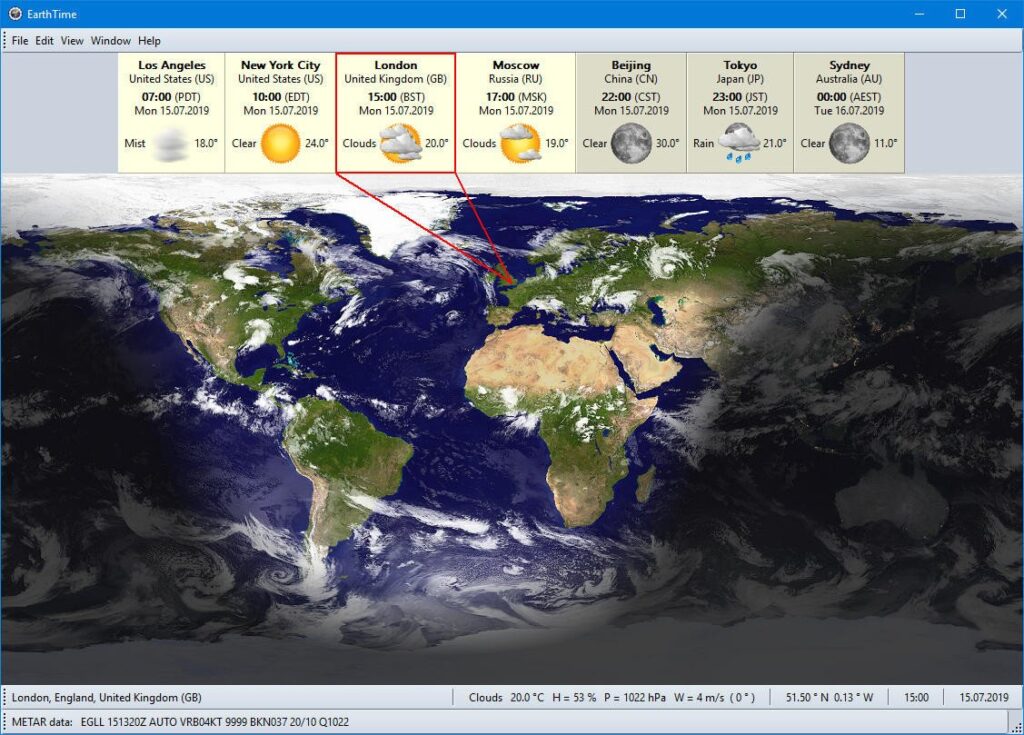
EarthTime is basically a browser-based data visualization system that overlays time-series data onto satellite imagery of the globe. It combines high-resolution satellite imagery with judiciously chosen datasets from authoritative sources like NASA, the World Bank, the UN, and Google Earth Engine. The system permits users to view the way in which some of the key indicators—temperature rise, sea-level rise, deforestation, energy usage, and refugee movement—have evolved over time.
By making available historical and real-time information, EarthTime allows users to explore global change on local, regional, and global scales.
Key Features of EarthTime
- Interactive Time-Lapse Visualizations
EarthTime allows users to create or interact with animated timelines of some of the key global issues. These time-lapse animations highlight the manner in which events unfold over a period of time—ideal for presentations, storytelling, or public awareness campaigns. - Data Layer Integration
With hundreds of preloaded data layers, EarthTime can visualize environmental, social, economic, and political data. Users can also upload custom datasets to create their own personalized stories. - User-Friendly Interface
EarthTime is designed for accessibility. Whether you’re a scientist analyzing climate change or a teacher explaining global migration, the platform is intuitive and requires no programming knowledge. - Educational and Policy Impact
Used in classrooms and global forums like the World Economic Forum, EarthTime supports data-driven decision-making and makes complex topics more accessible to broad audiences.
EarthTime for Climate Change and Sustainability
One of the most powerful applications of EarthTime is climate change visualization. It provides real-time data on:
Global temperature rise
Melting of ice sheets and sea-level rise
CO₂ emissions and energy consumption
Deforestation and biodiversity loss
These visualizations render climate science tangible and emotionally engaging, bridging the divide between raw data and public opinion.
Who Uses EarthTime?
EarthTime is being utilized across industries and sectors, including:
Educators and students – for teaching geography, environmental science, and global studies.
Journalists – to enhance stories with engaging visuals and data.
NGOs and policy institutes – for informed advocacy and policy-making.
Researchers and analysts – to study patterns and correlations among regions.
Its ability to visualize long-term data helps all users to better grasp the scale and speed of global change.
Why EarthTime Matters
In a world of data, EarthTime is an essential instrument for translating complex global data into clear, powerful visual storytelling. It democratizes access to big data and makes it actionable for individuals, organizations, and governments.
From raising awareness about climate change to monitoring economic trends, EarthTime offers a distinct way of visualizing our changing world.

Comments are closed.